
Connected stack
Northwind Metro
01
Turn raw incident data into maps, scores, charts, and reports people can read in seconds.
02
Northwind Metro
03
Vertex Safety
04
Orion Transit
LIVE CRIME MAPS
Track hotspots, trends, and risk by area with clear maps, scores, and charts. Compare neighborhoods in seconds and plan safer routes with less guesswork.
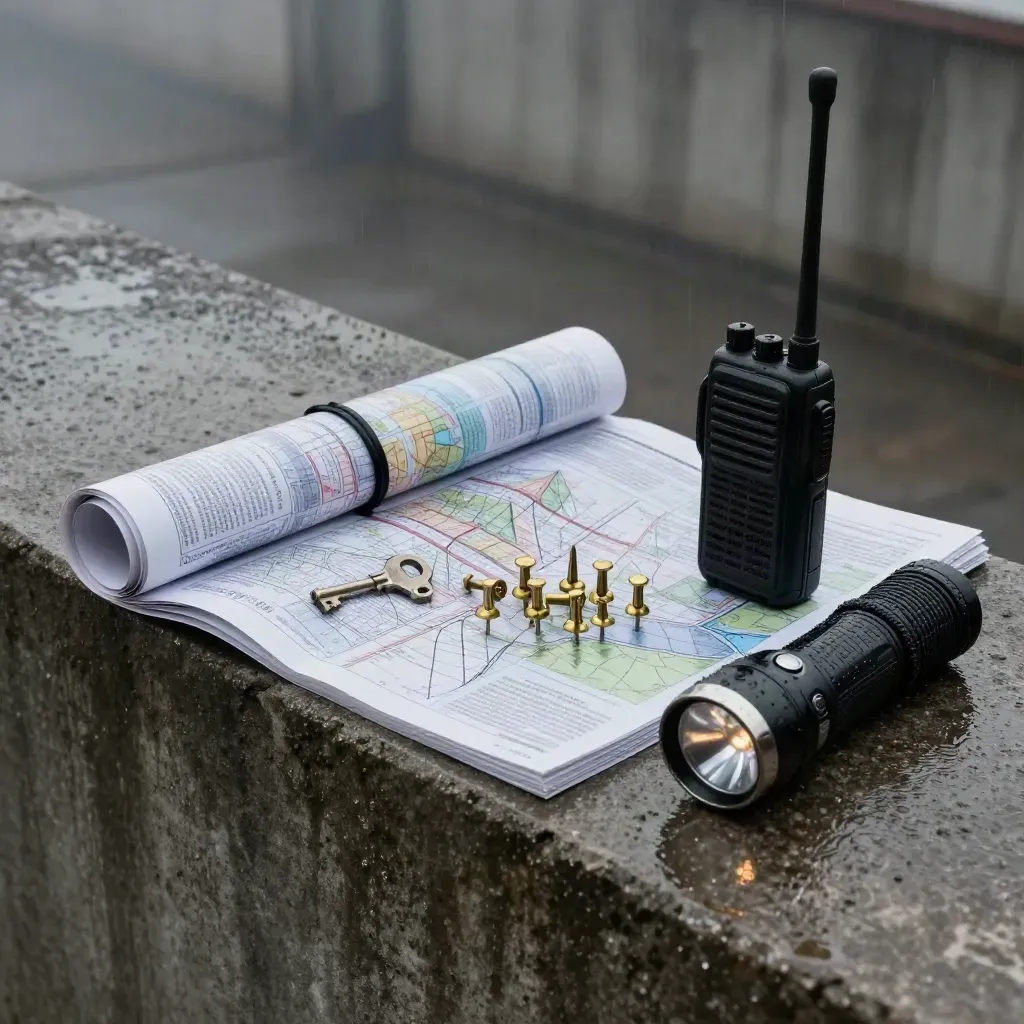
Connected stack
Turn raw incident data into maps, scores, charts, and reports people can read in seconds.
Northwind Metro
Vertex Safety
Orion Transit




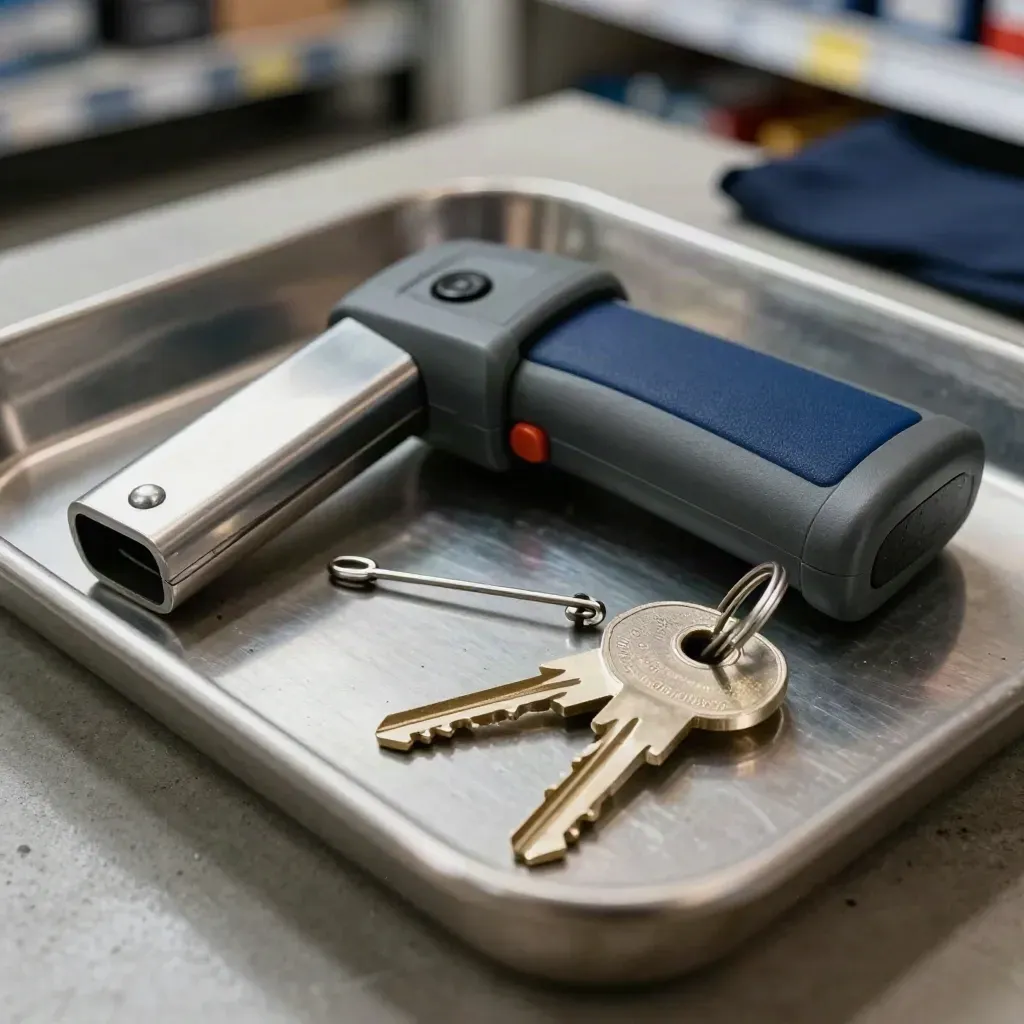

CORE MAP TOOLS
See hot zones by block, hour, and day in one live view.

See hot zones by block, hour, and day in one live view.

Rank neighborhoods with clear scores and color bands.

Track spikes, dips, and repeat calls over time.

Send simple reports with maps, scores, and notes.

Plan patrol paths on top of map layers and call data.

Compare two addresses side by side before you act.
WHO USES IT
Check local risk before rent, travel, or school pickup.
See hot zones by block, hour, and day in one live view.
Rank neighborhoods with clear scores and color bands.
Track spikes, dips, and repeat calls over time.
Send simple reports with maps, scores, and notes.

Use case 01
Check local risk before rent, travel, or school pickup.
Use case 02
Blend crime records, maps, and charts for quick readouts.

Use case 03
Plan patrol zones and shift routes from one screen.
records mapped

records mapped
postcode match rate
faster area checks
live map access
SIMPLE PRICING
1 city map Basic hotspot layer 7-day trend chart One area compare PNG export
$0
1 city map
Basic hotspot layer
7-day trend chart
One area compare
$49
5 city maps
Hourly hotspot refresh
30-day trend charts
Saved team views
Custom
Unlimited city maps
Data feed API
SSO and user roles
Audit logs for teams
Proof
“We used the map to spot two repeat zones before the weekend shift.”

Maya Chen
Ops Director @ Northwind
“The compare tool cut our site review time from hours to minutes.”

Derek Holt
Risk Analyst @ Vertex Labs
“Safety scores made it easy to brief our board with one page.”

Irene Park
Head of Planning @ HarborGate
Integrations
Turn raw incident data into maps, scores, charts, and reports people can read in seconds.

Turn raw incident data into maps, scores, charts, and reports people can read in seconds.

Turn raw incident data into maps, scores, charts, and reports people can read in seconds.

Turn raw incident data into maps, scores, charts, and reports people can read in seconds.

Turn raw incident data into maps, scores, charts, and reports people can read in seconds.
The Map
Journal

Questions
Quick answers before visitors choose a product, service, or next step.
We map public police feeds, open city records, and client data loads. You can check source notes and update dates on each map.
Update timing depends on the source. Most city feeds refresh daily, and your saved views can recalc when new records land.
Yes. Pick two neighborhoods or addresses and see side-by-side risk scores, trends, and hotspot shapes.
Yes. Overlay incidents on zones, roads, and shifts, then print a simple map for briefings and route checks.
Yes. Start free, test one city map, and keep sample reports before you choose a paid tier. No credit card needed.
Yes. Pro and Enterprise let you share saved dashboards with role-based access, so each team sees only what they need.
Get short notes on new map tools, data tips, and product updates in one email each month.


